
See enterprise risk exposure clearly - and connect every risk to the controls, incidents, and assets that shape it.
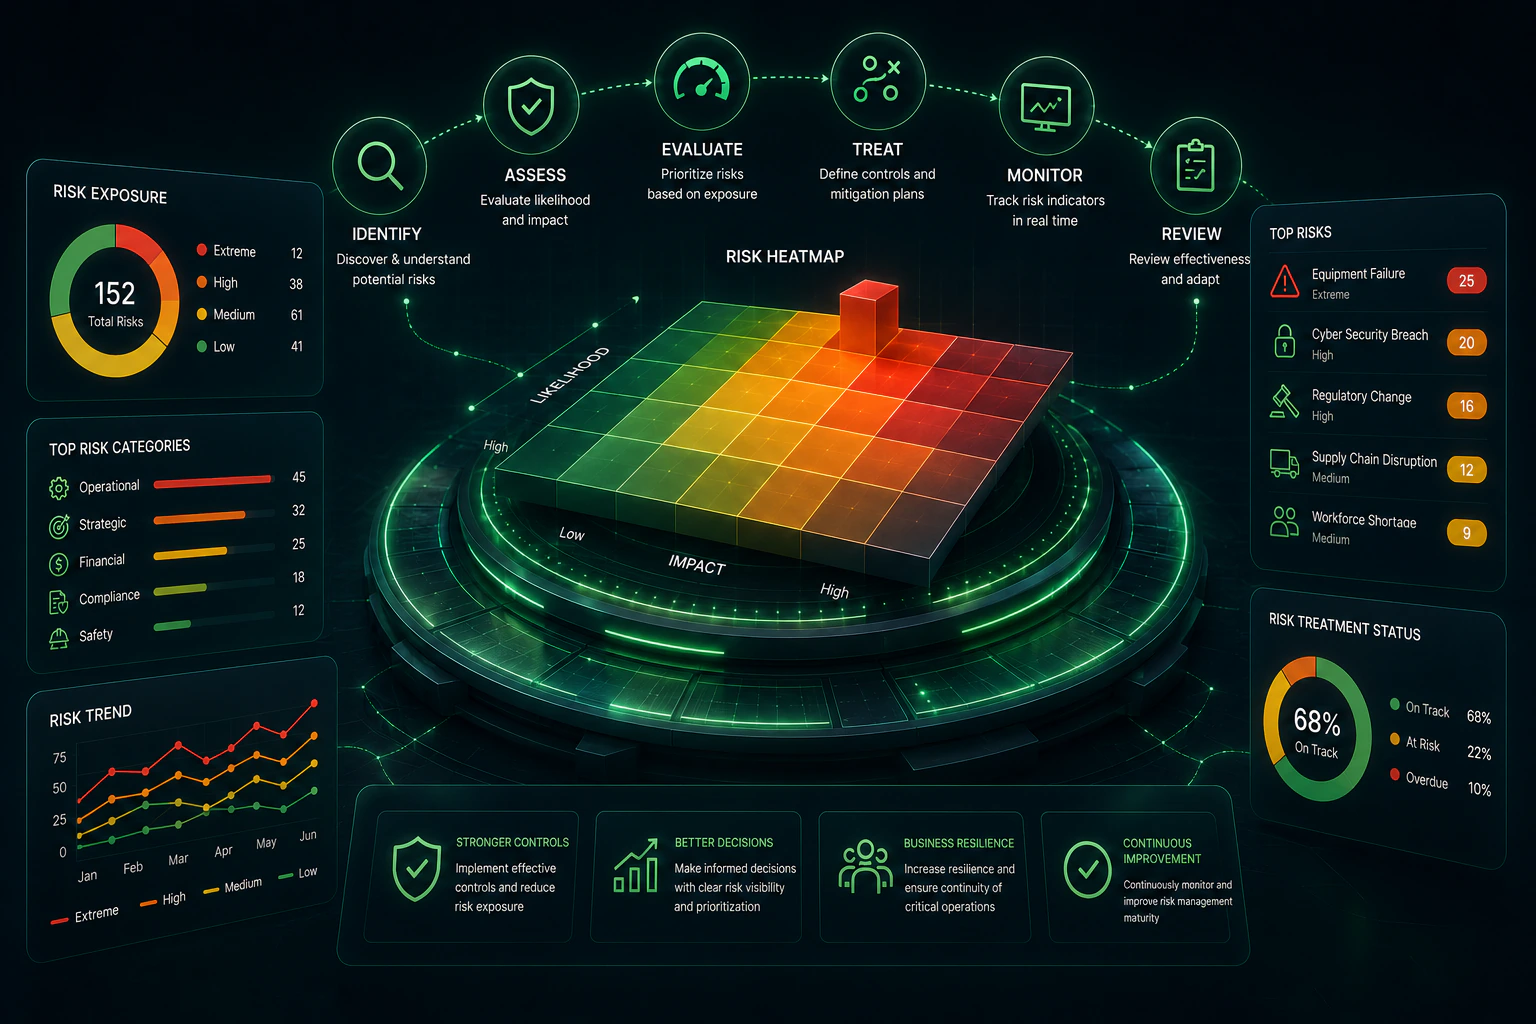
Configurable risk registers, inherent, residual and future scoring, appetite bands, and AI-assisted risk workflows - connected to controls, incidents, and assets.
The problems this solves
Risk lives in disconnected spreadsheets
Registers drift out of date, ownership is unclear, and no one can see enterprise exposure in one place.
Scoring is inconsistent
Different teams score likelihood and consequence differently, so exposure cannot be compared or rolled up.
Risks are not connected to reality
Risks are recorded separately from the incidents, controls, and assets that actually drive them.
What you can do
Availability is labelled honestly - items marked Configurable or On the roadmap are noted explicitly.
Configurable risk registers
Build registers to your own categories, objectives, and review cycles.
Likelihood & consequence scoring
Consistent, transparent scoring using a configurable scoring method.
Inherent, residual & future risk
Track risk before controls, after controls, and where it is heading - with rollups.
Risk appetite bands
Define appetite bands and see where exposure sits against tolerance.
Controls & treatments
Model safeguards and treatments with effectiveness ratings and treatment-progress rollups.
Ownership & review cycles
Assign owners and route reviews so registers stay current.
Reporting dashboards
Executive reporting across the risk pool, with an AI-generated summary option.
AI-assisted risk workflows
Predictive hotspots, control-gap analysis, and scenario simulation.
Who it's for
- Chief risk officers
- Risk managers
- Executives
- Organization administrators
How the workflow connects
- 01
Register
Capture a risk with category, owner, and objectives.
- 02
Score
Apply likelihood and consequence for inherent, residual, and future risk.
- 03
Treat
Link controls and treatments; track effectiveness and progress.
- 04
Connect
Link the risk to incidents, assets, and obligations that affect it.
- 05
Report
Roll exposure into executive dashboards and appetite bands.
What each team gets
Chief risk officers
One live view of enterprise exposure against appetite.
Risk managers
Consistent scoring and less spreadsheet chasing.
Executives
Board-ready reporting with drill-down to source records.
How this connects across Evalura
Explore related modules
Not sure where to start? Browse all products.
Frequently asked questions
Can we configure our own scoring method and categories?
Yes. Risk categories, objectives, review cycles, the scoring method, and appetite bands are all configurable master data.
How does the AI assistance work?
AI-assisted risk workflows (predictive hotspots, control-gap analysis, and scenario simulation) are a licensed feature that analyses your own risk and control data and presents structured output for human review.
Does risk connect to other modules?
Yes. Risks link to controls, obligations, incidents, and assets through the shared relationship layer.
Start a conversation
See Evalura connect your operational picture
Book a personalized demo and see how risk, compliance, incidents, assets, and maintenance connect into one operating system.